Published: May 2025
In the fast-paced world of Australian small and medium enterprises (SMEs), business reporting serves as the compass guiding informed decision-making and sustainable growth. With more than 2.5 million small businesses fuelling the economy and employing over 5.1 million people, the ability to generate accurate, timely reports is no longer optional - it's essential.
This comprehensive guide is designed for Australian SMEs, whether you're running a construction firm in Brisbane, a tech consultancy in Melbourne, or a retail outlet in Perth. We'll delve into practical strategies for implementing effective business reporting, complete with facts, examples, and calculations in Australian dollars (AUD).
By framing reporting not as a bureaucratic task but as a strategic asset, you'll learn how to track performance, identify opportunities, and mitigate risks. From financial summaries to operational dashboards, we'll cover it all with relatable Australian contexts to help your business thrive in today's data-driven landscape.
Business reporting involves compiling, analysing, and presenting data on various aspects of your operations, finances, and market position. For Australian SMEs, this means creating reports that comply with local regulations, such as those from the Australian Taxation Office (ATO) for GST and BAS submissions, while providing actionable insights. It's about transforming raw data - sales figures, customer feedback, inventory levels—into meaningful narratives that support strategic choices.
At its heart, business reporting bridges the gap between day-to-day activities and long-term goals. It encompasses periodic financial statements, performance metrics, and ad-hoc analyses, often using tools like spreadsheets or software such as MYOB or Xero. In an Australian context, where SMEs face unique challenges like regional economic variations and compliance burdens, effective reporting helps monitor cash flow amid rising costs and adapt to trends like digital transformation. It's a dynamic process that evolves with your business, ensuring transparency for stakeholders and empowering owners to spot issues early, such as declining profit margins in a competitive sector.
For Australian SMEs, business reporting is a lifeline in an economy marked by volatility, with insolvencies rising 36% in recent periods due to factors like inflation and supply disruptions. Without regular reporting, businesses risk blind spots - overlooking cash shortages that affect 40% of failures or missing growth opportunities in booming sectors like health care. Reports provide visibility into key areas, enabling data-backed decisions that enhance efficiency and profitability.
Consider the impact: SMEs with structured reporting are 2.5 times more likely to secure funding, as lenders scrutinise financial health through metrics like debt-to-equity ratios. In high-employment industries like retail and construction, reporting tracks labour costs against productivity, crucial when wages rise. For instance, during economic recoveries, detailed sales reports help capitalise on consumer spending surges, while compliance reports ensure adherence to superannuation and payroll tax rules, avoiding penalties that can reach AUD 20,000.
Reporting also builds resilience. In regional Australia, where transport costs fluctuate, operational reports optimise logistics, reducing expenses by up to 15%. Overall, it fosters accountability, improves forecasting, and supports scalability - turning SMEs into agile entities that contribute robustly to the national economy, where small businesses drive innovation and job creation.
An effective business reporting system for Australian SMEs comprises several core elements. These components form a cohesive framework, ensuring reports are accurate, relevant, and user-friendly. Below, we explore each in detail, including purpose, contents, and practical examples tailored to Australian businesses.
The executive summary distils the entire report into a concise overview, highlighting key findings, trends, and recommendations. It's typically one page, written last, and aimed at busy stakeholders like owners or investors. For Australian SMEs, include high-level metrics compliant with local standards, such as quarterly revenue growth aligned with ATO reporting periods.
This section sets the context, emphasising actionable insights. For a Sydney-based e-commerce SME, it might note: "Revenue increased 15% to AUD 250,000 this quarter, driven by online sales, but rising shipping costs reduced margins by 5%; recommend supplier negotiations." It frames the report's value, encouraging deeper engagement while providing a quick snapshot for decision-makers in time-poor environments.
Financial reports are the cornerstone, detailing income, expenses, assets, and liabilities. Include profit and loss statements, balance sheets, and cash flow summaries, prepared in accordance with Australian Accounting Standards. For SMEs, focus on tax implications like deductible expenses and GST credits.
Break it down with examples:
This component ensures financial health monitoring, vital for funding applications or ATO audits.
Operational reports track daily activities, such as production efficiency, inventory turnover, and customer service metrics. They help identify bottlenecks in processes unique to Australian SMEs, like supply chain delays from imports.
Examples include:
This fosters operational excellence, adapting to local challenges like workforce shortages in regional areas.
Key performance indicators (KPIs) quantify success against goals. Select relevant ones like return on investment (ROI) or customer acquisition cost, benchmarked against industry averages.
For Australian contexts:
This component drives accountability, helping SMEs in competitive markets like retail adjust strategies swiftly.
This analyses external factors, including market trends, competitor performance, and customer insights. Use data from sales patterns or surveys to inform positioning.
Examples:
Tailored for Australia, it accounts for trends like sustainability demands in consumer goods.
Compliance reports ensure adherence to laws, covering tax, safety, and environmental standards. Risk sections identify threats like economic downturns.
For SMEs:
This safeguards against penalties and builds trust.
Forecasting predicts future performance based on historical data, using tools like trend analysis.
Examples:
This aids planning in uncertain Australian economies.
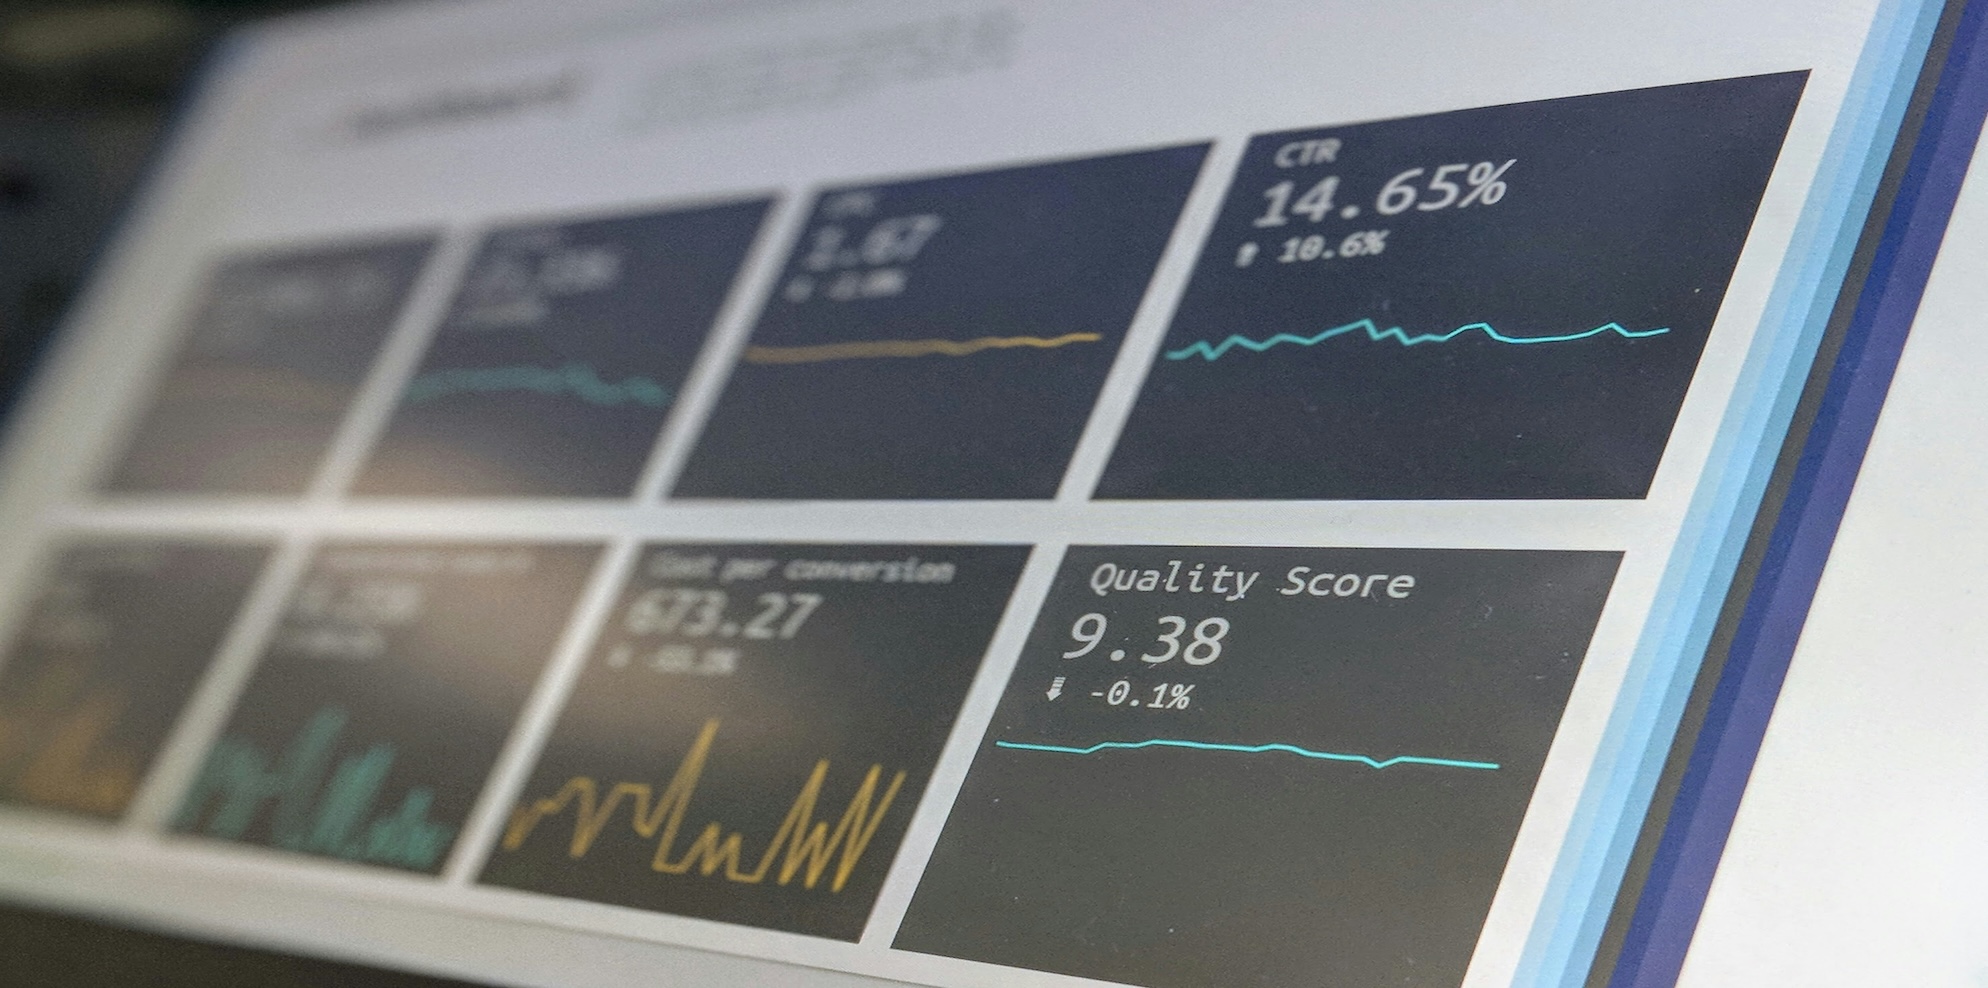
Incorporate charts, graphs, and dashboards for clarity, using software like Tableau or Excel.
Examples:
This enhances accessibility for non-experts.
Implementing business reporting requires a structured approach for Australian SMEs.
Identify reporting objectives, such as improving cash flow or compliance. Survey stakeholders for requirements.
Select user-friendly options like Xero for integration with ATO systems.
List KPIs, ensuring data from sales, finance, and operations is accurate.
Create standardised formats with sections as above.
Automate collection where possible, verifying for errors.
Perform calculations like ROI: (Gain AUD 20,000 - Cost AUD 10,000) / Cost x 100 = 100%.
Add charts and explanations for context.
Set frequencies - monthly financials, weekly operations - and share securely.
Evaluate effectiveness, adjusting based on user input.
Revise for changes like new regulations or business growth.
For a Perth cafe, this system revealed a 15% cost saving through inventory reports.
Business reporting empowers Australian SMEs to navigate challenges and seize opportunities through data-driven insights. By mastering key components, following implementation steps, and applying tips with practical calculations, you'll enhance decision-making and growth. Start building your system today for a stronger tomorrow.
Business reporting compiles and analyses data on finances, operations, and performance to inform decisions. Australian SMEs need it to monitor cash flow, ensure compliance with ATO rules, spot inefficiencies, and drive growth in a market where 60% fail early due to poor oversight.
For small businesses, reports should be 5-15 pages: concise summaries for executives (1-2 pages) and detailed sections for analysis. Tailor to purpose—financials might be shorter, while annual reviews longer—to avoid overwhelming readers.
Challenges include data inaccuracies, time constraints, and compliance burdens. Overcome by automating with software like MYOB, training staff, and scheduling regular reviews to ensure accuracy and relevance.
Use: (Net profit / Investment cost) x 100. For AUD 50,000 profit on AUD 100,000 investment, it's 50%. Subtract costs from gains, divide by investment, multiply by 100 for percentage insight.
Include profit and loss statements, balance sheets, cash flow forecasts, KPI dashboards, and compliance summaries to cover financial health, operations, and risks comprehensively.
Update monthly for financials, weekly for operations, and annually for strategic overviews, or after events like market shifts to keep data current and actionable.
Yes, free tools like Google Sheets or basic Excel templates provide starters, customisable for local needs like GST tracking before upgrading to paid software.
KPI tracking measures metrics like sales growth or customer retention. Apply by selecting 5-10 relevant ones, setting targets (e.g., 80% retention), and reviewing quarterly to adjust strategies.
Urban SMEs like in Melbourne focus on competitive metrics, while regional ones in Western Australia emphasise logistics costs; tailor reports to local economics for targeted insights.
Visualisation uses charts and dashboards to make data accessible, highlighting trends like sales spikes, improving comprehension and quick decisions in fast-paced SME environments.
Scale Suite is a Sydney-based provider of outsourced finance teams and fractional CFO services for Australian SMEs. We deliver weekly bookkeeping, payroll, BAS/IAS lodgement, cashflow reporting, management accounts, and strategic fractional CFO oversight - all as a fully embedded team that works inside your business.
CA-qualified, Xero Certified, and registered BAS Agents, we replace fragmented bookkeepers and once-a-year accountants with one responsive finance function at a fraction of the cost of full-time hires. We serve growing businesses across Sydney, Melbourne, Brisbane, and Perth, with packages starting from $1,500 per month and no lock-in contracts.
Learn more about our embedded finance model at scalesuite.com.au/services/finance
Scale Suite is a Sydney-based provider of outsourced finance and HR services for Australian SMEs. We deliver bookkeeping, financial reporting, payroll processing, fractional CFO support, recruitment, employee onboarding, people and culture support, and fractional HR oversight, all as a fully embedded team that works inside your business.
Employment Hero Gold Partner, CA-qualified, and Xero Certified, we replace fragmented finance and HR processes with one responsive, senior-level function at a fraction of the cost of full-time hires. We serve growing businesses across Sydney, Melbourne, Brisbane, and Perth, with packages starting from $1,500 per month and no lock-in contracts.
30 minutes with our team.
We'll review your current finance setup, compare the full cost of an internal hire against our embedded team, and show you exactly what your finance function should cost at your stage of growth.
You'll leave with a clear view of what's working, what's missing, and where you'd save.
No lock-in contracts. 30-day money-back guarantee.
Prefer to book directly? Grab a time here.