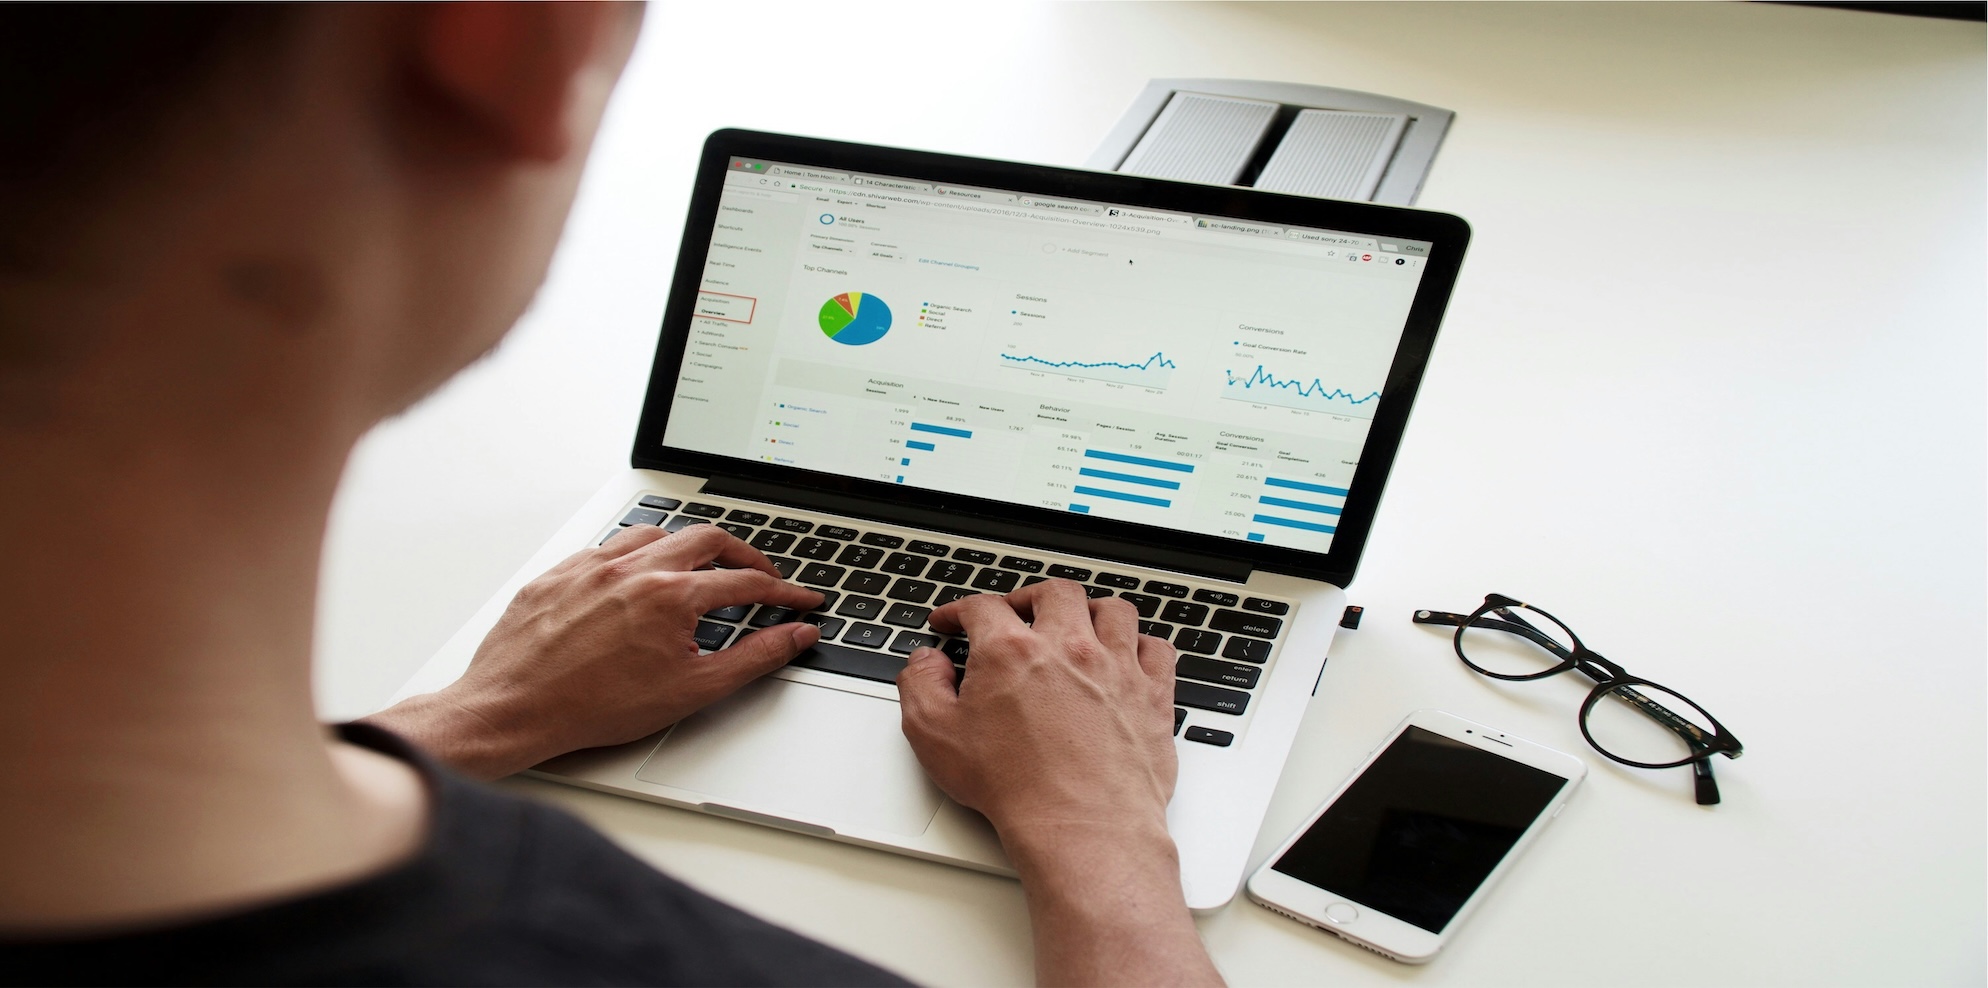
Your bookkeeper sends you reports every month. You open the email, scan the numbers, and close it. The profit looks fine, or it doesn't, and either way you move on to the actual work of running the business.
This is how most Australian business owners read their financials. It is also how most of them miss the warning signs that show up in the numbers months before they show up in the bank account.
The three reports that matter, profit and loss, balance sheet, and cash flow statement, tell three different stories. The P&L tells you whether you made money. The balance sheet tells you what you own and owe. The cash flow statement tells you whether the money the P&L says you made actually reached the bank. Most owners read the first one and ignore the other two, which is why "profitable on paper but cash-strapped in the bank" is the single most common reason Australian small businesses fail.
This guide walks through each report in plain English, line by line, with the ratios that actually matter, the red flags hidden in the detail, and the 20-minute monthly routine that turns financial reports from a chore into a control system.
Published: May 2026
There are three core financial statements in Australian accounting:
Together, these three reports give you the complete financial picture. Reading just one of them is like watching a footy game with the sound off and the score covered. You can see something is happening but you cannot tell what it means.
If your bookkeeper or accountant is only sending you a P&L, you are missing two thirds of the picture. Ask for the balance sheet and cash flow statement as well. They are produced automatically by Xero, MYOB, and every other mainstream accounting software at no extra cost.
The single most important concept in business finance is that profit and cash are different. They are calculated differently, they move at different speeds, and they tell you different things about the health of the business.
A worked example. A consulting business invoices $50,000 in May for work completed that month. The cost of delivering that work was $30,000 in wages, also paid in May. The P&L for May shows $50,000 revenue, $30,000 expense, $20,000 profit. Simple.
But the customer is on 30-day terms and doesn't pay until late June. The wages went out of the bank in May. So in May, the P&L showed $20,000 profit but the bank account dropped by $30,000. In June, the bank account goes up by $50,000 with no corresponding P&L impact. Across the two months, profit and cash balance out. But within any single month, they can move in opposite directions.
Now scale that up. A business growing fast at 30 percent year on year is invoicing more each month, paying staff and suppliers more each month, and watching its receivables balance grow as it waits to be paid. The P&L might show record profits while the bank account hits zero. This is called "growing broke" and it is the single most common way profitable Australian businesses fail.
The balance sheet is where you spot it before it kills you. The cash flow statement is where you understand why.
The P&L summarises revenue, expenses, and the profit left over for a defined period. For most Australian SMEs, the P&L is reviewed monthly.
For a full walkthrough specific to Xero, see our guide to reading Xero profit and loss reports and our general profit and loss guide.
The standard structure top to bottom:
Revenue (or Sales, or Turnover, or Income). The total value of goods or services sold in the period, recognised when invoiced (accrual basis) or when paid (cash basis). Most businesses run on accrual.
Cost of Goods Sold (COGS), or Cost of Sales. The direct costs of producing the goods or delivering the services that generated the revenue. For a manufacturer, this is raw materials and direct labour. For a services business, this is the wages of delivery staff and any direct project costs.
Gross Profit. Revenue minus COGS. This is the margin available to cover everything else.
Gross Profit Margin. Gross profit divided by revenue, expressed as a percentage. The benchmark varies wildly by industry. Professional services typically run 40-70%. Retail runs 25-50%. Hospitality runs 60-75% on food (lower on alcohol). Construction runs 15-30%. Comparing your gross margin to your industry tells you whether your pricing and delivery efficiency are competitive. Our gross profit margin benchmarks by industry guide sets out the typical ranges.
Operating Expenses (OpEx). Everything else needed to run the business: rent, utilities, marketing, software subscriptions, professional fees, administrative wages, insurance, telecommunications, motor vehicle costs, repairs and maintenance.
EBITDA (Earnings Before Interest, Tax, Depreciation, and Amortisation). A measure of operating profitability before financing costs and non-cash items. Useful for comparing businesses with different capital structures.
Depreciation and Amortisation. Non-cash expenses that spread the cost of fixed assets and intangibles over their useful life. The cash already went out when the asset was bought.
Interest Expense (or Finance Costs). The cost of debt.
Profit Before Tax (PBT). What's left for the owner before tax.
Income Tax Expense. The tax payable on the profit, calculated at the company tax rate (25% for base rate entities under $50M aggregated turnover, 30% otherwise) or, for trusts and partnerships, passed through to the beneficiaries or partners.
Net Profit After Tax (NPAT). The final figure. What the owner actually keeps.
Reading every line of your P&L every month is overkill. The five lines that move the business:
1. Revenue trend. Is revenue growing, flat, or declining compared to last month and the same month last year? Look at the trend, not the absolute number.
2. Gross profit margin. Compressing margin is the early signal of pricing pressure, rising input costs, or delivery inefficiency. A drop of 2-3 percentage points sustained over 2-3 months is a serious signal.
3. The largest operating expense line. For most service businesses, this is wages. For most retail businesses, it is rent or marketing. Whatever the biggest line is, that is where the leverage sits if you need to cut costs.
4. EBITDA margin. EBITDA divided by revenue. A clean comparison of operating profitability over time. A declining EBITDA margin while revenue grows means you are growing into lower-margin work or letting costs creep.
5. Net profit after tax. The bottom line. Compare to the budget if you have one and to the same period last year.
If you only look at five lines on your P&L each month, look at these five.
Your P&L does not show:
For those, you need the balance sheet.
The balance sheet is the single most underused report in small business finance. Most owners look at it once a year when their accountant produces the financial statements, if they look at it at all.
It is the report that shows you whether the business is actually healthy, separately from whether last month was profitable.
Every balance sheet on earth balances to one equation:
Assets = Liabilities + Equity
In plain English: everything the business owns (assets) was paid for either by borrowing (liabilities) or by the owner putting money in or leaving profits in the business (equity). The two sides always balance because every transaction has two sides. If you take out a $50,000 loan, your bank balance goes up by $50,000 (asset) and your debt goes up by $50,000 (liability). The equation still balances.
If your balance sheet doesn't balance, something is wrong with the bookkeeping. Get it fixed before you read anything else.
Assets are things the business owns or controls that have economic value. Split into two categories:
Liabilities are amounts the business owes. Split into two categories:
Equity is what's left for the owner after subtracting liabilities from assets:
Cash at Bank. The total of your business bank accounts. This is the most liquid asset on the balance sheet, but it is also the smallest part of the picture for most businesses. A business with $50,000 in the bank and $200,000 in overdue receivables is in much worse shape than the bank balance alone suggests.
Accounts Receivable (also called Trade Debtors). Money customers owe you for goods or services already delivered. This is the line that grows when business is good and your customers are slow, and it is the line that quietly kills cash flow. A healthy benchmark is that 80% or more of receivables should be under 30 days old. If 30%+ of your receivables are over 60 days old, you have a collection problem, not a sales problem.
The aged receivables report is the companion to this balance sheet line. Pull it monthly. If the same customers keep appearing in the 60+ column, deal with them. Money sitting in receivables earns no interest and may never be collected at all.
Inventory (also called Stock on Hand). For businesses that hold stock, this is the value of unsold goods. The two questions to ask: is the value on the balance sheet what you would actually realise if you sold it (not the original cost, the current realisable value), and is inventory growing faster than revenue? If yes to the second, you are tying up working capital in stock that is not turning into cash.
Prepayments. Expenses paid in advance that have not yet been "used up", like a 12-month insurance premium paid up front. These get amortised to the P&L over the period they cover.
GST Receivable (or Input Tax Credits). If you have paid more GST than you have collected (common in businesses with high capital expenditure), the ATO owes you a refund. This sits as an asset.
Property, Plant and Equipment (PPE). Vehicles, machinery, office equipment, furniture, computers. Shown at original cost less accumulated depreciation. A common confusion: PPE on the balance sheet rarely matches market value. A 5-year-old vehicle on the balance sheet at $5,000 (cost less depreciation) might be worth $20,000 on the open market, or $1,000, depending on the asset. Book value is an accounting number, not a market valuation.
Right-of-Use Assets. Under AASB 16, operating leases (office space, equipment leases) appear on the balance sheet as an asset (the right to use the leased item) and a corresponding lease liability. This applies to medium and large businesses; very small businesses can sometimes elect simplified treatment.
Intangible Assets. Goodwill from acquisitions, capitalised software, brand value. Subject to impairment testing if the value declines.
Investments. Shares in other entities, long-term term deposits, loans receivable.
This is the section that hides most of the financial pressure in small business.
Accounts Payable (also called Trade Creditors). Money you owe suppliers for goods and services already received. If this line is growing faster than revenue, you are stretching suppliers to fund the business, which is a sign of cash pressure.
GST Payable. GST collected from customers, less GST paid to suppliers, that you owe to the ATO. Due quarterly with the BAS for most small businesses, monthly for larger ones. This is not your money. Treat it as a liability that must be paid on time. See our BAS due dates guide and our simplified BAS calculator.
PAYG Withholding Payable. Tax withheld from employees' wages that you owe to the ATO. Reported and paid on the BAS. Again, this is not your money.
Superannuation Payable. Super accrued but not yet paid. Until 30 June 2026, super is payable quarterly under the SG regime. From 1 July 2026, Payday Super requires super to be paid within 7 business days of each pay run. This line will move much faster after that change.
Accrued Wages and Leave. Wages earned but not yet paid (because the pay date falls after period end), plus the value of accrued annual leave, personal leave, and long service leave. The leave provision can be material; for a 20-person business, accrued annual leave alone can sit at $200,000+ if leave balances are not actively managed.
Income Tax Payable. Company tax owed but not yet paid, including PAYG instalments.
Short-Term Loans and Current Portion of Long-Term Debt. Any debt due within 12 months. Important to identify because a loan you thought was "long-term" may have a balloon payment in the next 12 months that is sitting in current liabilities.
Customer Deposits. Money received from customers for work not yet performed. This is a liability until the work is done. Common in construction, hospitality, and events businesses.
Long-Term Loans. Business loans, equipment finance, vehicle finance with terms beyond 12 months.
Lease Liabilities. The non-current portion of any AASB 16 lease liability.
Provisions. Long service leave, warranty provisions, restoration provisions.
Deferred Tax. Tax that will eventually be payable but is not yet due, typically arising from timing differences between accounting and tax treatments.
For a company:
Issued Capital (or Share Capital). The money paid for shares when the company was set up or capital was raised.
Retained Earnings. Cumulative profits left in the business after dividends.
Current Year Earnings. Profit for the current financial year that has not yet rolled into retained earnings (it rolls over at the end of each financial year).
Director Loan Accounts (DLAs). If a director has lent money to the company, the company owes the director, and this can be an asset or a liability depending on how the bookkeeper has classified it. More commonly in small business, directors take money out of the company that has not been formally paid as wages, dividends, or a return of capital, creating a loan owed by the director back to the company. This is where Division 7A risk lives, and it is one of the most consequential lines on the balance sheet for Australian SME owners.
If the DLA shows a balance owed by the director to the company, and that balance is not formally documented under a complying loan agreement with regular repayments at the benchmark interest rate, the ATO can treat the amount as an unfranked dividend, which is taxable to the director at marginal rates. This catches small business owners every year. If your balance sheet shows a "Loan to Director" or "Director Loan Account" with a debit balance, talk to your tax accountant before 30 June about how to deal with it.
For a sole trader or partnership:
Owner's Capital. Money the owner put in.
Owner's Drawings. Money the owner has taken out. Drawings reduce equity but are not an expense (they are not deductible).
Current Year Earnings. Profit for the year.
Once you can read each line, the next step is the ratios that show the business's actual health.
1. Current Ratio = Current Assets / Current Liabilities
How well-equipped are you to pay your short-term obligations? A current ratio above 1.5 is generally healthy. Above 2.0 is comfortable. Below 1.0 means you have more short-term debt than short-term assets, which is a warning sign.
2. Quick Ratio (or Acid Test) = (Current Assets - Inventory - Prepayments) / Current Liabilities
The current ratio without inventory or prepayments, because those are not easily converted to cash. A quick ratio above 1.0 is healthy. Below 1.0 means if your customers all stopped paying tomorrow and you had to settle every current liability, you couldn't.
3. Debt-to-Equity Ratio = Total Liabilities / Total Equity
How leveraged is the business? A ratio under 1.0 means the business is funded more by equity than debt. Between 1.0 and 2.0 is normal for businesses with equipment finance or commercial loans. Above 3.0 is highly leveraged. Above 5.0 and lenders start saying no to new credit.
4. Working Capital = Current Assets - Current Liabilities
The buffer of liquid resources beyond short-term obligations. A growing working capital balance generally signals improving liquidity. Declining working capital while revenue grows is the early signal of "growing broke."
5. Return on Equity = Net Profit After Tax / Total Equity
How much profit are you generating for every dollar of owner equity in the business? A healthy small business should aim for 15-25% return on equity. Below 10% and the business is barely returning more than a term deposit on the capital tied up in it.
The ratios tell you the headline. These are the signals to look for in the detail.
1. Negative equity. Total liabilities exceed total assets. The business owes more than it owns. Unless you have a clear path to profitability or a capital injection, this is a solvency issue.
2. Receivables growing faster than revenue. Your customers are taking longer to pay. Cash flow pressure is coming.
3. A pile of receivables over 60 days old. Old debt is bad debt. Write off what you cannot collect and tighten payment terms on the rest.
4. Inventory ballooning. Stock is tying up cash. Either sales are slowing or you are over-ordering.
5. Accounts payable creeping up. You are stretching suppliers. They will eventually push back.
6. GST or PAYG payable growing month over month. You are using ATO money to fund operations. The ATO will eventually catch up, and director penalty notices for unpaid PAYG and super can make directors personally liable.
7. Super payable not zeroing out each quarter. You are behind on super. From 1 July 2026 under Payday Super, this becomes much more visible to the ATO and triggers the Super Guarantee Charge.
8. Director loan account with a debit balance. Money taken out of the company that has not been formalised. Division 7A risk.
9. Negative working capital. Short-term obligations exceed short-term resources.
10. Long-term debt growing while equity stays flat or shrinks. The business is becoming more reliant on debt to fund operations.
11. A material drop in cash with no corresponding new asset. Cash left the business and did not come back as an asset. This is usually owner drawings, debt repayment, or losses.
12. Goodwill that is large and growing. Acquisitions are being capitalised but the underlying businesses may not be performing. Goodwill is the first thing to be impaired in a downturn.
For more detail on the specific numbers that signal a business is heading for trouble, see our 5 numbers that tell you if your business is slowly going broke.
The cash flow statement reconciles the profit on the P&L to the actual change in cash during the period. It answers the question every small business owner asks at some point: "If we made a profit, where did the money go?"
The cash flow statement has three sections:
Cash generated by the core business. Starts with net profit (or EBITDA, depending on method) and adjusts for non-cash items (depreciation, amortisation) and movements in working capital (changes in receivables, inventory, payables).
If operating cash flow is consistently positive, the business is funding itself. If it is consistently negative while the P&L shows profit, the business is profitable on paper but cash-negative in reality, usually because of growth in receivables, inventory, or both.
This is the most important section of the cash flow statement. Operating cash flow is the sustainable funding source for everything else.
Cash spent on or received from investing activities: buying or selling fixed assets, buying or selling subsidiaries, buying or selling investments. Most small businesses have small or negative investing cash flow as they buy equipment, vehicles, and software.
Cash from borrowing or raising capital, and cash used to repay debt or pay dividends/drawings. A growing business taking on debt has positive financing cash flow. A maturing business paying down debt and returning capital to owners has negative financing cash flow.
Healthy small business cash flow patterns:
Unhealthy patterns:
If you are not sure how to forecast cash flow forward, our cash flow forecast calculator and our guide on how to read a cash flow statement cover the mechanics.
The single most common question business owners ask their bookkeeper: "If we made $100K profit, where is it?"
The answer is almost always somewhere on the balance sheet:
The cash flow statement maps each of these explicitly. If you cannot follow where the profit went on the cash flow statement, ask your bookkeeper to walk you through it line by line. They should be able to.
This deserves its own section because it is the single biggest balance sheet trap for Australian small business owners operating through a company.
Division 7A of the Income Tax Assessment Act 1936 treats certain payments and loans from a private company to a shareholder (or associate) as unfranked dividends, taxable to the recipient at their marginal rate.
A director loan account with a debit balance (the director owes the company money) at 30 June can trigger Division 7A unless:
If neither applies, the ATO can treat the entire balance as a deemed unfranked dividend in the year it arose, taxable to the director at marginal rates with no franking credit offset.
The risk is not theoretical. Division 7A audits are common, and the consequences run into tens of thousands of dollars in unexpected tax for owners who took money out informally and intended to repay it later.
If your balance sheet shows a director loan account with a debit balance at any point, particularly at 30 June, talk to your tax accountant before lodgement day. The fix is straightforward if you act in time and expensive if you don't.
A monthly review with your bookkeeper or finance person should cover, at minimum:
If your current bookkeeper cannot answer these questions, you are paying for data entry rather than financial insight. Most owners need the second, not the first.
You do not need to be an accountant to read your financials in 20 minutes a month. The routine:
Minutes 1-5: P&L scan. Open the P&L for the month. Look at the five lines that matter: revenue, gross profit margin, biggest operating expense, EBITDA margin, net profit. Compare to last month and the same month last year. Note anything that moved by more than 10%.
Minutes 5-10: Balance sheet scan. Open the balance sheet at month-end. Check cash at bank, accounts receivable (and aged receivables), accounts payable, GST/PAYG/super payable, debt balances, and equity. Calculate the current ratio and the quick ratio. Note any red flags.
Minutes 10-15: Cash flow check. Open the cash flow statement. Confirm operating cash flow was positive (or understand why it wasn't). Identify where any large cash movements went.
Minutes 15-20: Action list. Write down 3-5 things you want to do or ask about in response to what you saw: chase a specific customer, pay down a specific debt, get clarity on a specific expense, ask your bookkeeper about a specific movement.
That is the entire review. Done monthly, it gives you control over the business that 95% of Australian SME owners never have.
If your business is growing, taking on debt, raising capital, preparing for sale, or running tight on cash, monthly reports from a bookkeeper are not enough. You need management reporting that includes:
This is the work of a finance manager or fractional CFO, not a bookkeeper. For most Australian SMEs, the natural progression is bookkeeper at startup, bookkeeper plus part-time finance manager at $2-5M revenue, and fractional CFO oversight at $3M+ revenue. For the full cost picture, see our complete guide to fractional CFO costs in Australia and how much does a fractional CFO cost in Sydney.
The Scale Suite model is to deliver weekly bookkeeping, monthly management accounts, and fractional CFO oversight as one embedded team, which is the model that gets most SME owners to the point where their financials genuinely drive decisions rather than just describe history.
What is the difference between a balance sheet and a profit and loss statement?
A profit and loss statement shows revenue, expenses, and profit over a period of time (typically a month, quarter, or year). A balance sheet shows what the business owns, owes, and the owner's equity at a single point in time. The P&L is a movie. The balance sheet is a photograph. Both are needed to understand the business's financial health.
How often should I review my financial reports?
Monthly at minimum. The 20-minute monthly review of the P&L, balance sheet, and cash flow statement gives you the control most Australian SME owners never have. Quarterly or annual reviews are too infrequent to catch problems before they become serious.
What is a healthy current ratio for an Australian small business?
Above 1.5 is generally healthy. Above 2.0 is comfortable. Below 1.0 means current liabilities exceed current assets and the business may struggle to meet short-term obligations. Industries with fast cash conversion (cafes, hospitality) often operate with lower current ratios. Industries with long payment cycles (construction, professional services) need higher current ratios to manage the lag.
What does negative equity on a balance sheet mean?
Negative equity means total liabilities exceed total assets. The business owes more than it owns. Unless there is a clear path to profitability or capital injection, this is a solvency issue. Directors should seek immediate advice as continuing to trade while insolvent can attract personal liability for company debts.
Why doesn't my bank balance match my profit?
Profit is calculated on accrual accounting: revenue is recognised when invoiced, expenses when incurred. Cash moves at different times. Profit can be locked up in receivables (customers haven't paid), inventory (stock hasn't sold), capital expenditure (you bought equipment), or paid out as GST, PAYG, debt repayments, or owner drawings, none of which reduce P&L profit. The cash flow statement reconciles these differences.
What is a director loan account and why is it important?
A director loan account records amounts owed between a director and their company. If the director owes money to the company at 30 June and the balance is not repaid by the company's lodgement day or covered by a complying Division 7A loan agreement, the ATO can treat the amount as an unfranked dividend taxable at marginal rates. Australian SME owners operating through a company should review director loan account balances each year before 30 June.
What is the difference between accrual and cash accounting in Australia?
Cash accounting recognises revenue when payment is received and expenses when payment is made. Accrual accounting recognises revenue when invoiced and expenses when incurred, regardless of when cash moves. Most Australian businesses run on accrual accounting because it gives a more accurate picture of underlying performance. The ATO generally requires accrual accounting for businesses with turnover over $10 million. See our cash vs accrual accounting Australia guide for the full picture.
What is working capital and why does it matter?
Working capital is current assets minus current liabilities. It measures the liquid resources available to fund day-to-day operations. Growing businesses often see working capital tighten because receivables and inventory grow faster than payables, absorbing cash. Watching working capital trends is the single best early warning system for cash flow stress.
What is a good gross profit margin for an Australian business?
It varies significantly by industry. Professional services typically run 40-70%. Retail runs 25-50%. Hospitality runs 60-75% on food, lower on alcohol. Construction runs 15-30%. Manufacturing varies widely depending on inputs. The right benchmark is your industry, not businesses in general.
What is EBITDA and is it the same as profit?
EBITDA is Earnings Before Interest, Tax, Depreciation, and Amortisation. It is a measure of operating profitability before financing costs and non-cash items. EBITDA is not the same as net profit. It is useful for comparing businesses with different capital structures or for valuing a business for sale. It is not a substitute for net profit when assessing whether a business is making money in absolute terms.
Why does my balance sheet not balance in Xero?
The balance sheet must balance to the accounting equation (Assets = Liabilities + Equity). If it does not balance in Xero, the most common causes are: an unreconciled bank account, an opening balance entered incorrectly when the file was set up, a journal entered to one side only, or a manual journal that did not balance to itself. Have your bookkeeper investigate before relying on any other balance sheet number.
What is the difference between owner's drawings and a salary for a sole trader?
Owner's drawings reduce equity on the balance sheet but are not an expense on the P&L. A sole trader cannot legally pay themselves a salary because they are not separate from the business. Drawings are not deductible. The sole trader's taxable income is the business profit, regardless of how much was drawn out during the year. For a company, the director can be paid a salary or wages, which is a deductible expense.
Do I need a balance sheet if I'm a sole trader?
You are not required to lodge a balance sheet with the ATO as a sole trader, but you should still prepare one to understand your business's financial position. A balance sheet shows you what your business owns and owes, separately from your personal finances, and is essential if you apply for business finance, take on a partner, or sell the business.
How long should I keep financial records in Australia?
The ATO requires business records to be kept for 5 years from the date they were prepared, obtained, or the transaction was completed, whichever is later. Some records (relating to capital gains, fringe benefits, or losses carried forward) need to be kept longer. Employment records must be kept for 7 years under the Fair Work Act. The safe rule for most documents is 7 years.
Scale Suite is a Sydney-based provider of outsourced finance teams and fractional CFO services for Australian SMEs. We deliver weekly bookkeeping, payroll, BAS/IAS lodgement, cashflow reporting, management accounts, and strategic fractional CFO oversight, all as a fully embedded team that works inside your business.
CA-qualified, Xero Certified, and registered BAS Agents, we replace fragmented bookkeepers and once-a-year accountants with one responsive finance function at a fraction of the cost of full-time hires. We serve growing businesses across Sydney, Melbourne, Brisbane, and Perth, with packages starting from $1,500 per month and no lock-in contracts.
Visit Scale Suite | View Our Finance Services | View Our HR Services | Get Your Free Proposal
Disclaimer: We review and check this guide periodically. At the time of writing (May 2026), all information was current. Scale Suite is a registered BAS Agent, not a licensed tax advisor or financial advisor. This content is general information only and does not constitute professional tax, financial, or legal advice. Some details may change over time.
Scale Suite is a Sydney-based provider of outsourced finance and HR services for Australian SMEs. We deliver bookkeeping, financial reporting, payroll processing, fractional CFO support, recruitment, employee onboarding, people and culture support, and fractional HR oversight, all as a fully embedded team that works inside your business.
Employment Hero Gold Partner, CA-qualified, and Xero Certified, we replace fragmented finance and HR processes with one responsive, senior-level function at a fraction of the cost of full-time hires. We serve growing businesses across Sydney, Melbourne, Brisbane, and Perth, with packages starting from $1,500 per month and no lock-in contracts.
30 minutes with our team.
We'll review your current finance setup, compare the full cost of an internal hire against our embedded team, and show you exactly what your finance function should cost at your stage of growth.
You'll leave with a clear view of what's working, what's missing, and where you'd save.
No lock-in contracts. 30-day money-back guarantee.
Prefer to book directly? Grab a time here.